The tracing provides the user to identify the time consuming SQL Queries, transactions and different code that executes on AOS. The performance could be measured and unnecessary load and process can be identified and avoidable.
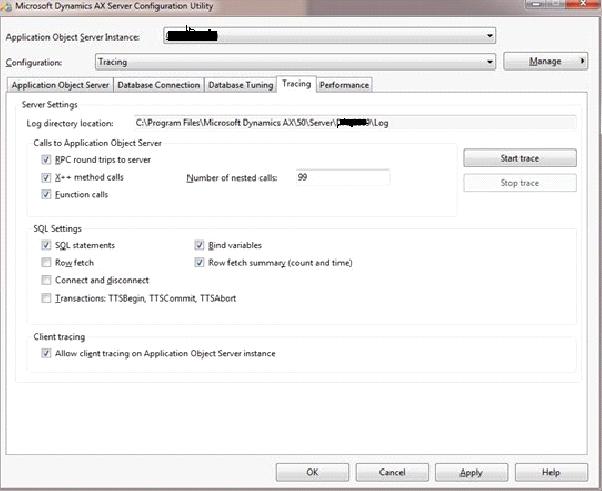
RPC round-trips to server :This lets user to trace all RPC round-trips from client to the server.
X++ method : The calls traces all X++ methods that are invoked on the server.
Number of nested calls : Limits tracing to the specified number of nested method calls.
Function calls : Lets the user to trace all function calls that are invoked on the server.
SQL statements : Lets the user to trace all SQL Server statements that are invoked on the server.
Bind variables : Lets the user to trace all columns that are used as input bind variables.
Row fetch : Lets the user to trace all rows that are fetched using SQL Server
Row fetch summary (count and time) : Counts all rows that are fetched, and records the time spent fetching
Connect and disconnect : This option traces each time the AOS connects and disconnects from the database
Transactions: ttsBegin, ttsCommit, ttsAbort This option lets to trace all transactions that use the TTSBegin, TTSCommit, and TTSAbort statements
There's a detailed explanation on tracing which is provided by Tom Stumpf at the following links athttp://blogs.msdn.com/b/axinthefield/archive/2011/03/25/dynamics-ax-tracing-part-1.aspxhttp://blogs.msdn.com/b/axinthefield/archive/2011/03/25/dynamics-ax-tracing-part-2.aspx
Performance Analyzer for Microsoft Dynamics
The Performance Analyzer for Dynamics is a tool which collects data from several Data Management Views (DMVs) and enables to
- Investigate Blocking
- Investigate SQL statements
- Investigate Indexes
- Investigate SQL Server configurations
For more information on this tool visit this site at http://archive.msdn.microsoft.com/DynamicsPerf
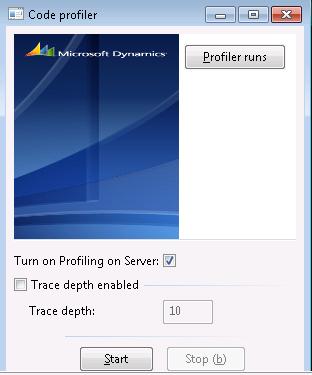
Code Profiler
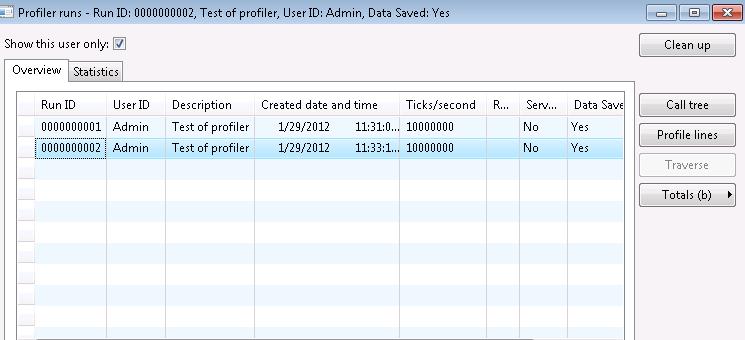
The code profiler is used to calculate the X++ code execution time and the database activity time. When you start a Profiler and stop after execution, the information is stored in the database with the RunID. When you click on the Profiler runs, it will show all the RunID's and the tasks which were executed.
To avoid unnecessary disturbance of several tasks and want to use it for just a special task, you could use the following code. To execute this sample code change the Table Name and Column Name.
// This is a sample to show how to use code profiler for a specific user task.
static void execCodeProfiler(Args _args)
{
// replace YourTableName with Original Table Name
    YourTableName tableName;
    Counter counter;
    ;

// profile start point.
#profileBegin("Test of profiler")
    while select tableName
    {
    // replace ColumnName with the Orginal Column Name
    info(strFmt("Table name: %1", tableName.ColumnName));
    counter++;
    if (counter >= 10)
    break;
    }
#profileEnd
// profile stop point.

}
Now you can see the Run ID and other information in Profiler runs screen, basically this type of scenario is used when checking the performance of the object by running several times and checking the duration result.
No comments:
Post a Comment